Get Myself a New Blog
更换新的个人网站
采用RStudio’s blogdown package + hugo theme + netlify approach.
If you want to see a few nice examples of websites written with blogdown/Hugo, check these out:
相关资料如下:
Markdown Elements for Hugo/Wowchemy: A complete tutorial for writting markdown on Wowchemy 是一个有用的教程,在设置网页的过程中,关于Yaml设置的部分讲解的很详细!
给旧的个人网站搬家,进行以下的测试吧!
测试R常用的模块
R 代码测试
library(zeta.forecast)
library(zetaEDA)
enable_zeta_ggplot_theme()
# testing for `r name`
name <- "Chen"testing for inline code chunk:
Say My Name!
# here I used the inline code `r  name`
# check if it shows correct as **Chen**
Chen
R table, ggplot and interactive plot testing
print and table
dat_tbl <- tsbox::ts_tbl(monthPay)

# print
head(dat_tbl)
## # A tibble: 6 × 2
## time value
## <date> <dbl>
## 1 2017-01-01 606.
## 2 2017-02-01 634.
## 3 2017-03-01 716.
## 4 2017-04-01 775.
## 5 2017-05-01 814.
## 6 2017-06-01 868.# table print
head(dat_tbl) %>%
print_kbl(cap = "testing table")| time | value |
|---|---|
| 2017-01-01 | 605.8086 |
| 2017-02-01 | 634.0597 |
| 2017-03-01 | 716.2454 |
| 2017-04-01 | 774.6870 |
| 2017-05-01 | 814.3505 |
| 2017-06-01 | 868.1338 |
DT Table
We need to using the widgetframe 📦 to fulfill the task.
# the belowing code does not work
# head(dat_tbl) %>%
#   DT::datatable()

# install.packages("widgetframe")
tmp <- DT::datatable(dat_tbl)
widgetframe::frameWidget(tmp)
GT Table
head(dat_tbl) %>%
print_gt()| time | value |
|---|---|
| 2017-01-01 | 605.8086 |
| 2017-02-01 | 634.0597 |
| 2017-03-01 | 716.2454 |
| 2017-04-01 | 774.6870 |
| 2017-05-01 | 814.3505 |
| 2017-06-01 | 868.1338 |
It works fine.
ggplot
静态的 ggplot 图像没有问题!See figure @ref(fig:p1)
ets_forecast(monthPay) %>%
  plot_forecast(interactive = FALSE)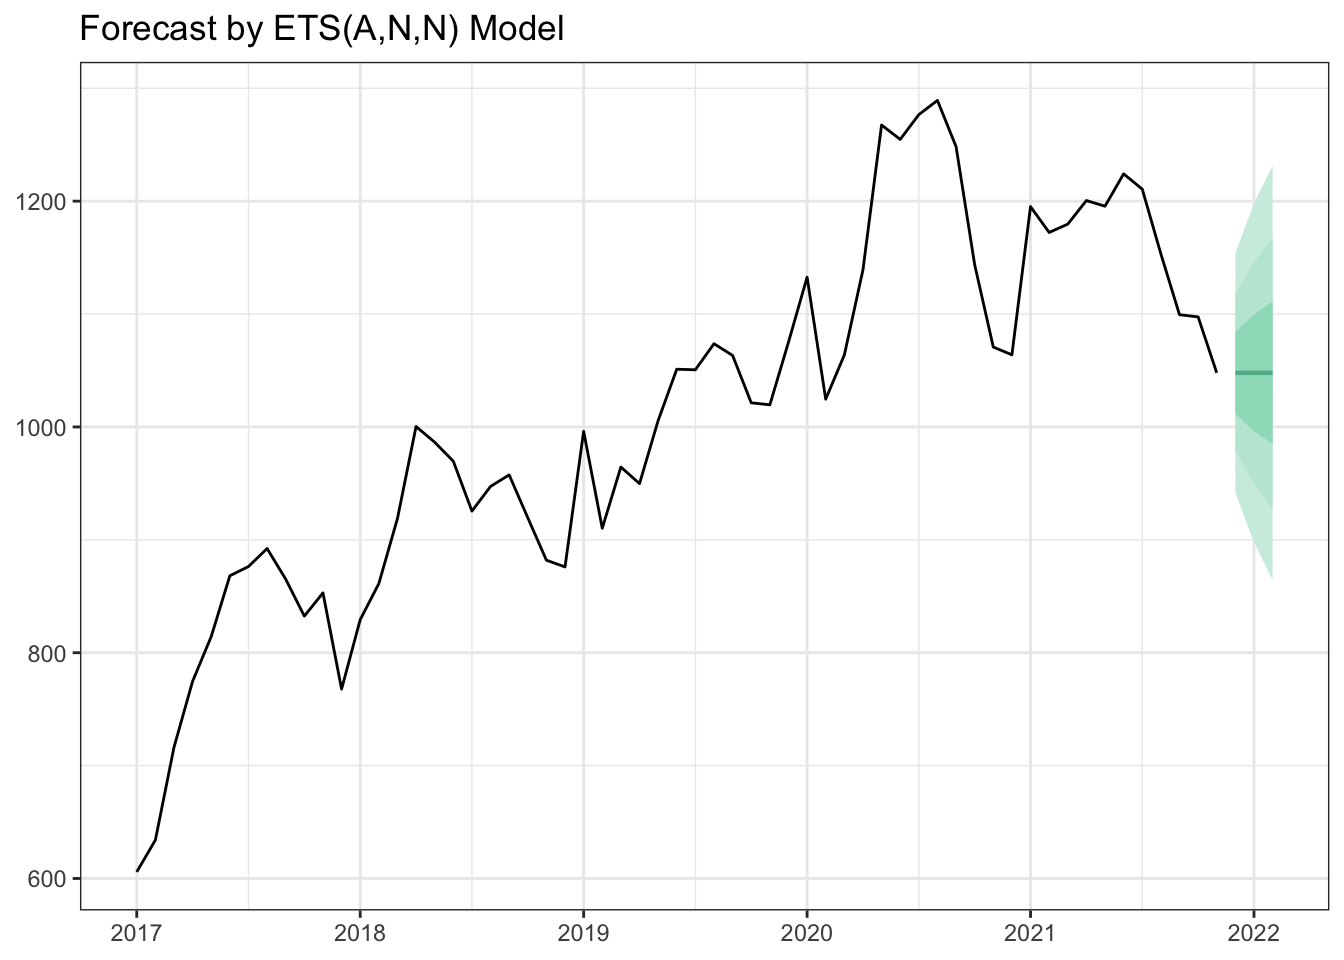
Figure 1: testing plot
interactive plot
plotly output showed appropriately!
ets_forecast(monthPay) %>%
  plot_forecast(interactive = TRUE)
\(\LaTeX\) 代码测试
how about this?
\[f(k;p_{0}^{*}) = \begin{cases}p_{0}^{*} & \text{if }k=1, \\ 1-p_{0}^{*} & \text{if }k=0.\end{cases}\]
Ok!
测试Markdown
markdown code to insert image

测试是没有问题的,我们可以直接用 RStudio 中的Visual Mode 直接把图片导入进来。RStudio 很聪明的在该post的目录下建立了一个image 📁,并将图片复制进去,同时给出了对的路径!
这样用的是 []() 的方式。
下面来测试html的方式:

<img src="https://tva1.sinaimg.cn/large/e6c9d24egy1h3gv1r375tj20yc0sq0va.jpg" alt="截屏2022-06-14 11.00.05" style="zoom:25%;" /> 这个方式也是没问题的。
Add Google Analytics
params.ymal中的google analytics.signup google analytics here.
copy the Measurement ID into the
params.ymalfile.wait and refresh the google analytics to check if it works.
Maybe this video is helpful: